The National Science Foundation: Center for Food Innovation and Diversification to Advance the Bioeconomy (FoodID), an NSF Global Center
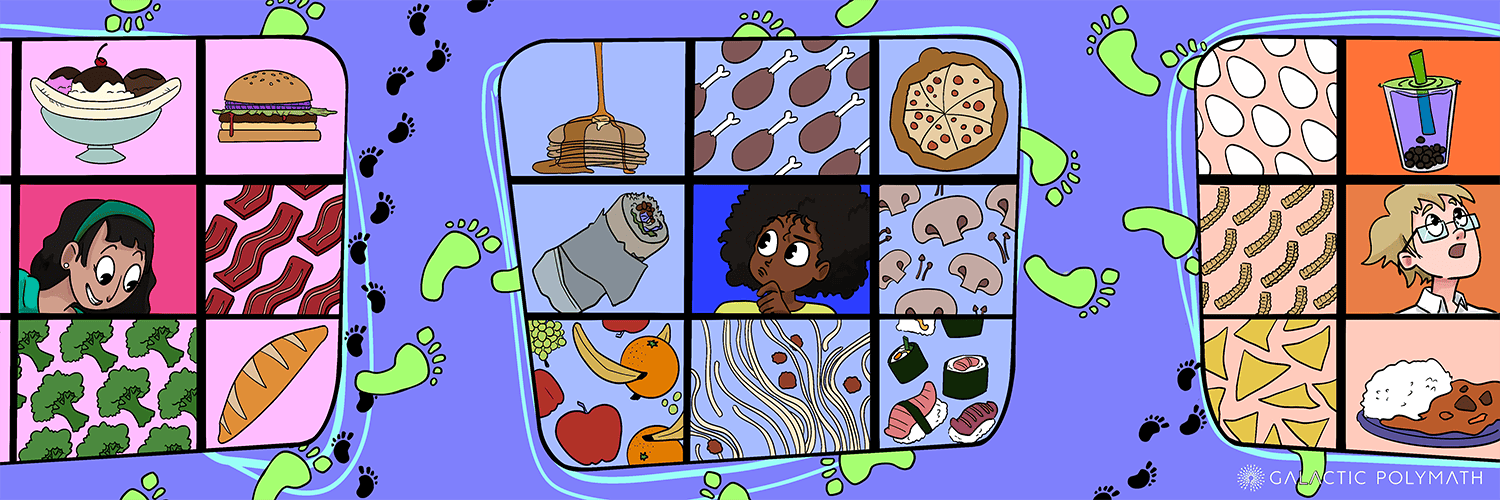
Food and climate are deeply connected. Students will dig into data to discover how our food choices impact greenhouse gas emissions. They will propose solutions to reduce their carbon “foodprint,” both as current consumers and as future food engineers. Students will eat this up in class and savor it for years to come!
Explore carbon footprints by focusing on YOUR favorite food.
Build data literacy while understanding about the climate impacts of our food system.
A fun video to review students' carbon "foodprint" knowledge in a gameshow format.
This video introduces how carbon footprints are determined by the food supply chain.
Students will be able to...
Understand that the sustainability of our food system has environmental, economic, and social aspects.
Evaluate the carbon footprints of commonly consumed foods.
Draw evidence-based conclusions about what makes certain foods more sustainable than others.
What Are You Eating? Slides Presentation (Lesson 1)
Need: WiFi, Computer, Projector, Sound
Teacher Key: My Favorite Dish (Lesson 1)
Print 1
Data Handout 1: Greenhouse Gas Emissions (Lesson 1)
Print Class Set
Student Worksheet: My Favorite Dish (Lesson 1)
Print 1 Per Student
PPSTT Cheat Sheet for Notes (Lesson 1)
Print 1 Per Student (we have this separated to chunk the lesson)
5 min: Hook
What is your favorite food?
Facilitate a quick discussion on students' favorite foods as a hook for the lesson.
15 min: Background
What is a carbon footprint?
Learn the basics of a carbon footprint, and analyze data. Use this as an opportunity to assess and address student understanding and misconceptions of greenhouse gases and carbon footprint concepts.
Guided questions to facilitate discussion for the PPSTT framework can be found in the Speaker Notes on the corresponding slides.
20 min: Connect
What are you eating?
Students will use specific data to explore the carbon footprint of their favorite dish with the Lesson 1 Student Worksheet.
5 min: Exit Ticket
Hypothesize
Hypothesize
Push students thinking to make a prediction about how carbon footprints are calculated.
Ideas and resources for deepening learning on this topic.
Explore the full food emissions data set behind this unit here.
Open access, complementary resource for further learning of climate change, food production, and food security topics.
Introduce students to ambitious, optimistic plans by world leaders to feed the growing human population!
If students get really curious about why they like certain foods more than others, check out our unit about the science of preferences.
Students will be able to...
Understand that the sustainability of our food system has environmental, economic, and social aspects.
Evaluate the carbon footprints of commonly consumed foods.
Draw evidence-based conclusions about what makes certain foods more sustainable than others.
Food For Thought Slides Presentation (Lesson 2)
Need: WiFi, Computer, Projector, Sound
Data Handout 2: Supply Chain for Food (Lesson 2)
Print Class Set
Teacher Key: Carbon "Foodprint" of My Favorite Dish (Lesson 2)
Print 1
Student Worksheet: Carbon "Foodprint" of My Favorite Dish (Lesson 2)
Print 1 Per Student
5 min: Review and Recap
What is a carbon footprint?
Review carbon footprint concepts from Lesson 1.
Watch ▶ Test your food carbon footprint knowledge! #sustainability to see how much you know about the carbon footprint of foods as a review from Lesson 1 or as an introduction to Lesson 2.
15 min: Background
Watch NPR Explainer Video
▶ The Carbon Footprint Of A Sandwich explains how greenhouse gases are released at each stage of production for different food items.
Why do certain foods have a higher carbon footprint than others?
Continue to build data literacy and deepen understanding of carbon footprint concepts.
20 min: Connect
Analyze the carbon footprint of your favorite dish.
Students will continue to use specific data to understand which factors determine the carbon footprint of their favorite dish in the Lesson 2 Student Worksheet.
Timers are embedded on the Slides. Feel free to add more time for your learners if needed.
5 min: Exit Ticket
Taking it Further
Taking it Further
Prompt students to think about ways they can make changes to lower the carbon footprint of their favorite dish.
If time allows, here are some options for extensions:
Ideas and resources for deepening learning on this topic.
Explore the full food emissions data set behind this unit here.
You or your students can read this blog from Our World in Data to understand more context around the data you've been exploring.
Introduce students to ambitious, optimistic plans by world leaders to feed the growing human population!
Our World in Data has a lot more data for students to explore their questions about the environmental impacts of food. Here's a great chart about carbon footprints and other impacts of different milk options.
Open access, complementary resource for further learning of climate change, food production, and food security topics.
Teacher Key FutureFoods Assessment Printable
Print 1
Share your feedback in < 5 min to help us demonstrate impact to funders:
Metaphors help us make sense of the world by connecting new concepts and phenomena to familiar ones. “Footprint” is a metaphor for the amount of carbon a process or activity adds to the atmosphere.
How does the footprint metaphor help us make sense of greenhouse gas emissions?
Where did the carbon footprint idea come from?
What are the limitations of “carbon footprint” as a metaphor for understanding greenhouse gas emissions?
Can you think of other ways to describe how carbon in the atmosphere affects the health of our planet?
This unit is based on cutting-edge research by the FoodID team. “ID” stands for innovating and diversifying, which is how these scientists are working to build a more sustainable food system. First, however, they need to understand the inputs and outputs at each phase of food production, processing, and distribution, as well as their impacts on the planet. It’s a complex problem, and students will engage with this complexity by using data to calculate the carbon footprint of their favorite dish and unpack what it means. Like FoodID researchers, students will identify key points in the system where their “foodprint” might be reduced. Finally, they will flex their creativity and problem-solving savvy (the skills of future food engineers!) and consider both social and technological solutions to develop a more sustainable version of their favorite dish.
Everything we eat has a story. It starts long before the food appears on our table and continues even when the meal has faded from memory. Our systems for growing, harvesting, processing, transporting, packaging, preserving, distributing, and preparing food are continually remaking our planet, using land, energy, water, and other raw materials while generating byproducts at each stage. Incorporating renewable resources can make the food system more sustainable, but it also creates new technological, environmental, nutritional, and social challenges. In order to meet these challenges, the FoodID team is harnessing the power of plants and microbes to produce healthy food for everyone—a blueprint for a future food system scientists call the bioeconomy. To make foods that are delicious, affordable, and healthy for people and the planet, FoodID researchers are developing new ingredients and new ways of producing and processing them. To accomplish this, they are tackling several key challenges to the bioeconomy. Our research has four major aspects:
Dimension:Performance Expectation
Students will make connections between the increase in global temperatures and our food supply.
Dimension:Science & Engineering Practices
Students will compare data sets to ask questions about which factors determine the total carbon footprint of food items.
Students will compare data sets in different formats to help understand the carbon footprint of food items.
Dimension:Cross-Cutting Concepts
Students will use the PPSTT framework to build data literacy.
Dimension:Reading
Students will use data sets (graphs and tables) to find and support claims using specific evidence.
Dimension:Writing
Students will develop claims, supported by evidence, about the carbon footprint of common food items.
Students will use specific data to support claims.
Dimension:Performance Expectation
In Lesson 2, students explore carbon impacts of food production by stages from farm to table. This allows them to reflect on how large scale farming to feed growing human populations lead to climate change.
Dimension:Disciplinary Core ideas
Students will develop a plan for now and a plan for the future to help minimize the impact of our food supply on climate change and Earth's resources.
Students will learn about the impact of our food supply on climate change, and make informed decisions on how to minimize the impact.
Dimension:Science & Engineering Practices
Students will calculate percentages to graph the carbon footprint of their favorite food.
Dimension:Planet
Students will learn about the journey of food items through the supply chain, and consider solutions on how to decrease the impact.
Laura Perry | Designed and developed all curricular materials
Matt Wilkins | Oversaw development of all materials, wrote script and directed videos
Stephanie Castillo | Produced, edited, narrated, and scored supporting videos
Jocelyn Bosley | Defined outreach goals; provided feedback throughout development; provided scientific validation of lesson content
Julia McQuillan | Defined outreach goals; provided feedback throughout development; provided scientific validation of lesson content
This work was funded by NSF Award 2435264
Provided funding and validated scientific accuracy of content
May 29, 2025
May 8, 2025
April 25, 2025
April 24, 2025
Adding standards and front matter
February 27, 2025